
What are the KPIs for mobile apps in e-commerce? What do they mean and how do they help? Key performance indicators (KPIs) are essential for any business – they help evaluate and measure what works and what needs improvement. The same goes for mobile e-commerce apps – monitoring KPIs is crucial for marketing and overall development.
Analyzing and reporting on key performance indicators (KPIs) can help to improve the performance of your mobile app and lead to increased revenues. So, what are the KPIs you should be monitoring for your mobile e-commerce app? Let’s take a look.
One of the most important KPIs for any e-commerce business is conversion rate – that is, the percentage of users who make a purchase after using your app. By tracking this metric, you can see how effective your app is at converting users into customers. Other important KPIs include bounce rate (the percentage of users who leave after only viewing one page), time on site/app (how long users spend on your site or app), and average order value (the average amount spent per order).
To get started with tracking KPIs, you’ll need to set up analytics software to collect data on app usage. Once you have this data, you can start to see patterns and trends in user behaviour. With this information, you can make changes to improve your app’s design, functionality, and content in order to boost conversions and keep users coming back. So, don’t delay – start monitoring your KPIs today to take your mobile e-commerce business to the next level!
Retention Rate
Retention rate is a key metric for understanding customer loyalty. It tells you what percentage of customers are still using your product or service.
- Retention rates can be measured based on purchases, app downloads, or first user logins. Retention rates are important because they show how well your product or service is engaging customers over time.
- If retention rates are low, it may be a sign that your product is not meeting customer needs. Retention rates can also be a useful tool for benchmarking your business against other businesses in your industry.
- By understanding retention rates, you can identify areas where your business needs to improve in order to keep customers loyal.
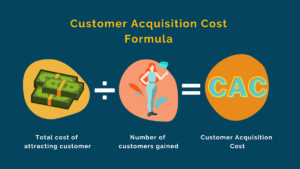
Customer Acquisition Cost (CAC)
Customer acquisition cost (CAC) is the sum of money spent to bring in new customers. It includes expenses like advertising, marketing team costs, production costs, and other technical and creative costs. To figure out CAC, simply divide the total budget for marketing and sales by the number of new customers gained during that period.
For example, let’s say your marketing and sales budget for the quarter was $100,000 and you acquired 100 new customers in that quarter. Your CAC would be $1,000.
Customer acquisition costs can vary greatly from one business to another and even within the same industry. For example, a company that sells expensive products or services will usually have a higher CAC than a company that sells cheaper products or services. This is because it costs more money to market and sell expensive products or services.
There are a number of ways to reduce customer acquisition costs. One way is to increase the efficiency of your marketing and sales efforts. Another way is to lower the price of your products or services. And yet another way is to offer discounts or other incentives to customers who purchase your product or service.
Of course, reducing customer acquisition costs is not always possible or desirable. In some cases, it may be necessary to increase customer acquisition costs in order to grow your business. For example, if you are launching a new product or service, you may need to spend more on marketing and sales in order to generate interest among potential customers.
Customer acquisition cost is an important metric for any business that sells products or services. By understanding your CAC, you can make informed decisions about how much to spend on marketing and sales, and how to best use those resources to acquire new customers.
Installs/Uninstalls
As any app developer knows, getting users to download your app is only half the battle. You also need to make sure that they complete the installation process and don’t immediately uninstall it. Otherwise, you’ll never know if your app is actually being used.
Monitoring installs and uninstalls can give you valuable insights into how users are interacting with your app. If you see a sudden drop in installs after a specific update, it could be an indication that something is wrong with the update. Similarly, if you see a lot of users uninstalling your app without providing any feedback, it could be an indication that there’s a problem with the app itself.
In either case, paying attention to installs and uninstalls can help you diagnose and fix problems with your app before they cause too much damage.
Daily Active Users
Daily active users (DAU) is a metric that measures the number of unique users who use your app each day. The DAU number is important because it shows how valuable your app is for those who installed it. A high DAU indicates that your app has achieved a status of necessity and is being used daily by your users.

To calculate your DAU, simply divide the total number of unique users by the number of days in the period being measured. For example, if you had 1,000 unique users in a 30-day period, your DAU would be 1,000/30, or 33.3. The higher the DAU, the more engaged and loyal your user base is. Daily active users is a key metric for any mobile app and should be monitored closely to ensure continued user engagement and retention.
Session Length
Session length is a critical engagement indicator for any mobile application. It reveals the average amount of time users spend on your app each day. This metric gives you a general idea of how your mobile app functions and holds users’ attention. If your customers are using your app multiple times daily for long periods, it may show that your app is user-friendly and offers a great customer experience.
Examining the lengths of sessions can assist marketers in distinguishing between highly engaged and loyal customers versus those who are less committed.
Session duration is an important metric to watch because it can give you insights into how well your app is performing and how engaged your customers are. By understanding this metric, you can make changes to improve your app and the customer experience.
Calculating Customer Lifetime Value (CLV)
Customer Lifetime Value (CLV) is an indicator that demonstrates the worth of each consumer to your enterprise. To calculate CLV, you need to multiply the average number of conversions over time by the average conversion rate and then by the average user lifetime.
For example, if the average conversion rate is 2% and the average number of conversions is 10, then the CLV would be 20. However, if the average user lifetime is only 6 months, then the CLV would be only 10.
The reason why customer lifetime value is so important is because it allows you to determine what value (income or profit) you can anticipate from your average user. If you know that each customer is worth $20 to your business, then you can easily calculate how much money you need to spend on marketing in order to acquire new customers. Customer lifetime value is also a key metric for determining whether or not a particular marketing campaign is successful. If you spend $100 on a campaign and only acquire 5 new customers, then your CLV would be negative. However, if you spend $100 on a campaign and acquire 10 new customers, then your CLV would be positive.
There are many ways to enhance customer lifetime value. One way is to improve the customer experience. If your customers are happy with your product or service, they are more likely to keep using it and to recommend it to others. Another way to increase CLV is to offer loyalty programs or discounts for repeat customers. This will encourage customers to keep coming back, which will in turn increase your revenue.
If you want to grow your business, it’s important to focus on increasing customer lifetime value. By doing so, you’ll be able to acquire new customers while also retaining existing ones.
The Average Revenue Per User
The average revenue per user, or ARPU, is a metric that shows the average profit generated per user from in-app purchases. In order to calculate your ARPU, you should divide the lifetime revenue of the app by the number of lifetime users. The average revenue per user metric will show you how much profit each user is bringing in, on average.

This figure is important because it can help you determine which users are most valuable to your app and which users you should be targeting in your marketing efforts.
Additionally, the ARPU can be a helpful tool for evaluating the success of new features or changes to your app. If you see a decrease in the ARPU after implementing a new change, it may be indicative of a problem with the change itself. Conversely, if you see an increase in the ARPU, it may be indicative of a successful change. Thus, monitoring the ARPU can be a useful way to gauge the overall health of your app.
Try Mobiroller
Mobiroller is the perfect tool for anyone who wants to build an online app quickly and easily. With Mobiroller, you can create a beautiful and professional looking app in minutes, without any prior experience or design skills. Plus, Mobiroller offers a wide range of features and integrations that will help you run your business smoothly.